The shaded region in the figure above represents the solution set of which system of inequalities?
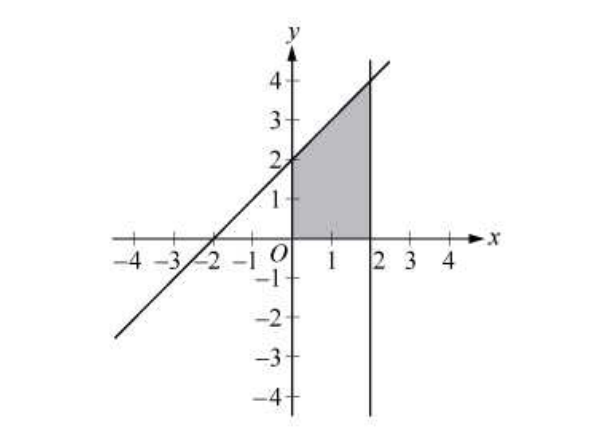
0 <= x <= 2; 0 <= y <= x + 2
The shaded region in the figure correctly represents the solution set for the system of inequalities defined by 0 <= x <= 2 and 0 <= y <= x + 2. This indicates that x is constrained between 0 and 2, while y is constrained to be non-negative and less than or equal to the line defined by y = x + 2, within the bounds of x.
This choice incorrectly allows x to take negative values down to -2. The shaded region in the figure does not extend into the negative x-axis, making this option invalid since it fails to conform to the specified bounds for x.
This option suggests that y must be at least 2, which is not reflected in the shaded region. The region clearly shows that y starts from 0 and goes up to the line y = x + 2, making this choice inconsistent with the visual representation.
This choice reverses the roles of x and y by restricting y up to 2 and allowing x to depend on y. The shaded area does not show y being capped at 2, nor does it show a dependency of x on y, therefore this option is incorrect.
While this option correctly defines y in relation to x, it does not restrict x to the interval [0, 2]. Therefore, it implies that x could extend infinitely to the right, which is not represented by the shaded area in the figure.
The inequalities represented by the shaded region accurately describe the constraints of x and y in option B. The other choices either misrepresent the allowed ranges for x and y, leading to incorrect interpretations of the region. Understanding these relationships is crucial for accurately interpreting the graphical representations of systems of inequalities.
Related Questions
View allWhich of the following is equivalent to √(a ^ 6 * b ^ 12) - √(a ^ 3)...
The parabola y = 1 - x ^ 2 is shown in the xy-plane above. The graph o...
If log(x - a) = 2 then x is equal to which of the following?
If ab ≠ 0, which of the following is equivalent to (8a * b ^ 7)(- 7a...
On a certain day, there were 104 pennies in jar A and 20 pennies in ja...
Related Quizzes
View allAmerican Government CLEP Cheat Sheet
CLEP College Algebra Exam Guide
CLEP College Mathematics Exam Secrets Study Guide
CLEP History of the United States II Examination Guide
CLEP History of the United States II Examination Guide
Humanities CLEP Test Study Guide
CLEP Humanities Test Questions
CLEP Introductory Psychology Examination Guide
College Level Examination Program CLEP Exams Hack
CLEP Western Civilization I Exam Secrets Study Guide
- ✓ 500+ Practice Questions
- ✓ Detailed Explanations
- ✓ Progress Analytics
- ✓ Exam Simulations