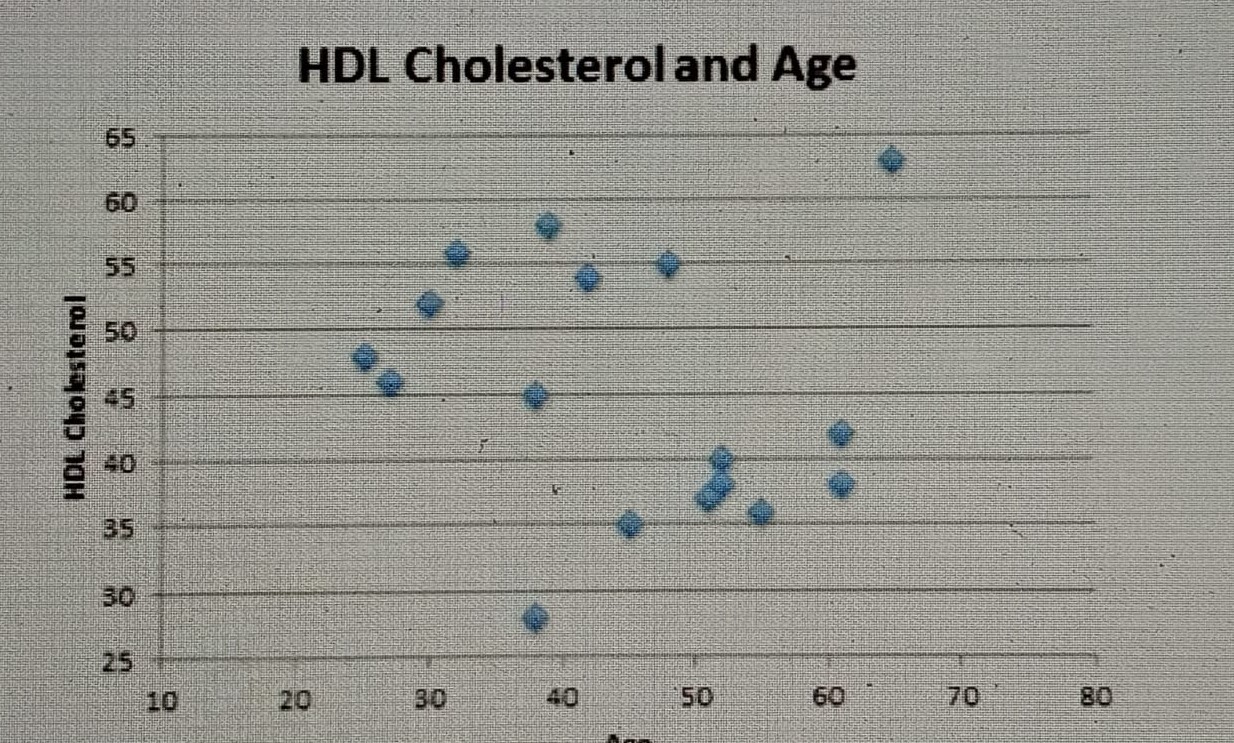
What accurately describes the strength of the distribution and the relationship between the variables?
Weak positive
A weak positive relationship indicates that as one variable increases, the other variable tends to also increase, but the correlation is not strong, meaning the data points are dispersed and not closely aligned along a trend line.
This choice correctly identifies the nature of the relationship between the variables as being weakly correlated in a positive direction. This means that there is some tendency for the values of one variable to increase as the other variable increases, but the relationship is not strong enough to be considered robust or consistent.
A strong positive relationship would suggest that the data points are closely clustered around a line of best fit, indicating a consistent and predictable increase in one variable with respect to another. Since the relationship described is weak, this choice does not accurately reflect the observed data.
A weak negative relationship implies that as one variable increases, the other variable tends to decrease, but with a low correlation. This choice contradicts the described relationship, which is positive rather than negative, thus making it incorrect.
A strong negative relationship would indicate a clear, consistent decrease in one variable with an increase in the other variable, which is opposite to the nature of the relationship stated in the question. Therefore, this choice is also incorrect.
The accurate description of the relationship between the variables is a weak positive correlation, signifying that while there is a slight tendency for both variables to increase together, the strength of this relationship is not significant. Recognizing the distinction between weak and strong correlations is crucial for interpreting data accurately in statistical analysis.
Related Questions
View allA hospital's latest survey of its service area shows that 30% of the p...
What are the principal square roots of 64 and 16?
A box contains one red ball, one purple ball, and one blue ball. Two b...
A medical researcher has been reviewing the data between amount of tim...
What accurately describes the strength of the distribution and the rel...
Related Quizzes
View all0PC1 Planning Instructional Strategies for Meaningful Learning Version 1
AP01 Elementary Literacy Curriculum Version 1
ASO1 Introduction to Statistics for Research Version 1
BJ01 Introduction to Business Finance Version 1
C172 Network and Security Foundations Version 1
C180 Introduction to Psychology Version 1
C180 Introduction to Psychology Version 2
CKC1 Introduction to Humanities Version 1
DZ01 Mathematics for Elementary Educators III MATH 1330 Version 1
FF01 Human Growth and Development Version 1
- ✓ 500+ Practice Questions
- ✓ Detailed Explanations
- ✓ Progress Analytics
- ✓ Exam Simulations