The shaded region in the figure above represents the solution set of which system of inequalities?
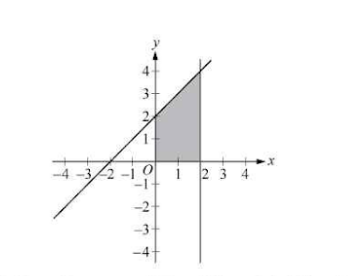
0 <= x <= 2, 0 <= y <= x + 2.
The solution set represented by the shaded region corresponds to the inequalities where x is constrained between 0 and 2, and y is bounded below by 0 and above by the line y = x + 2. This accurately captures the area described in the figure.
This choice incorrectly includes negative values for x, which do not appear in the shaded region. The range for x should start at 0, eliminating any possibility of negative x-values, thus misrepresenting the solution set.
This choice correctly describes the boundaries of the shaded region. The x-values are confined between 0 and 2, while y-values start from 0 up to the line defined by y = x + 2, accurately representing the constraints shown.
This option misrepresents the lower boundary for y, stating that y must be at least 2. The shaded region includes y-values starting from 0, making this choice incorrect.
Here, the inequalities incorrectly suggest that x is dependent on y, which is not the case. The shaded region does not restrict x in relation to y in this manner, thus failing to reflect the proper solution set.
Although this choice correctly shows y bounded by x + 2, it fails to limit x to a maximum of 2. Without this upper boundary, the solution set expands beyond the shaded region depicted.
The correct representation of the shaded region is given by the inequalities 0 <= x <= 2 and 0 <= y <= x + 2, which accurately highlights the constraints on x and y. Other options either misstate the boundaries or incorrectly relate x and y, confirming that choice B is the only option that fully encompasses the solution set as depicted in the figure.
Related Questions
View allA cereal box is 2 inches wide, 6.25 inches long, and 10 inches high. A...
Which of the following is a factor of 36x² - 16y^2?
If z = 5 + 3i, which of the following is the complete conjugate of z?
The graph of the function y = f(x) is shown in the xy-plane above. Whi...
The graph of which of the following functions in the xy-plane has more...
Related Quizzes
View allAmerican Government CLEP Cheat Sheet
CLEP College Algebra Exam Questions
CLEP College Mathematics Exam Secrets Study Guide
CLEP History of the United States II Examination Guide
CLEP History of the United States II Examination Guide
Humanities CLEP Test Study Guide
CLEP Humanities Test Questions
CLEP Introductory Psychology Examination Guide
College Level Examination Program CLEP Exams Hack
CLEP Western Civilization I Exam Secrets Study Guide
- ✓ 500+ Practice Questions
- ✓ Detailed Explanations
- ✓ Progress Analytics
- ✓ Exam Simulations