The scatterplot above shows the number of daily customers wearing winter gloves and the number of cups of soup sold daily at a lunch bistro during several winter months. Based on the scatterplot, which of the following statements best describes the relationship between the number of daily customers wearing winter gloves and the number of cups of soup sold daily?
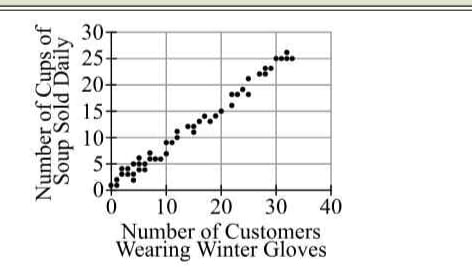
There is a positive linear correlation between the number of daily customers wearing winter gloves and the number of cups of soup sold daily.
The scatterplot reveals that as the number of daily customers wearing winter gloves increases, the number of cups of soup sold daily also tends to increase, indicating a positive relationship between the two variables.
A negative correlation would suggest that as one variable increases, the other decreases. However, the scatterplot clearly shows that both variables move in the same direction, negating any possibility of a negative correlation.
This choice accurately describes the relationship depicted in the scatterplot, where an increase in the number of daily customers wearing winter gloves corresponds with an increase in soup sales.
Claiming no correlation would imply that changes in one variable have no effect on the other. The data shown in the scatterplot contradicts this, as there is a clear upward trend.
This statement contradicts the observed data, which indicates that both metrics increase together. It incorrectly implies an inverse relationship that the scatterplot does not support.
While this statement reflects the observed correlation, it assumes causation rather than mere correlation, which is not supported by the scatterplot alone without further experimental evidence.
The scatterplot demonstrates a positive linear correlation between the number of daily customers wearing winter gloves and the number of cups of soup sold. This relationship indicates that more customers lead to higher soup sales, suggesting a connection between colder weather and increased soup consumption. Understanding this correlation can help in predicting sales trends in winter months.
Related Questions
View allR and S are 2-digit positive integers. R is a multiple of 5, and S is...
If the graph above represents the majors of the entire junior class, w...
In the figure above, if w = 70, v = 50, and z = 40, then x =
The scatterplot above shows the amount of United States exports of tra...
A sample of liquid from a drainage ditch is analyzed, and the percent...
Related Quizzes
View allPraxis 5001 Test with Answers
Praxis 5002 Study Guide
5002 Praxis Practice Test
Reading & Language Arts Praxis 5002
Praxis 5002 Reading and Language Arts Exam
Praxis 5003 Exam with Outline
5003 Praxis Math Answers
Praxis 5003 Study Guide
Praxis Social Studies 5004
Praxis 5004 Social Studies
- ✓ 500+ Practice Questions
- ✓ Detailed Explanations
- ✓ Progress Analytics
- ✓ Exam Simulations