If the graph above represents the majors of the entire junior class, what is the ratio of the number of juniors majoring in engineering to the total number of juniors in the class?
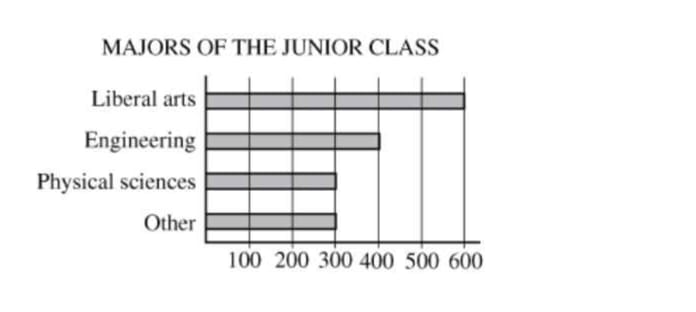
The ratio of the number of juniors majoring in engineering to the total number of juniors in the class is 3 to 8.
In the given graph, the number of juniors majoring in engineering is represented as 12, while the total number of juniors in the class is 32. Therefore, the ratio of engineering majors to the total number of juniors simplifies to 3 to 8 (12/32 reduces to 3/8).
This choice suggests that for every 16 juniors, only 1 is majoring in engineering. If we multiply 1 by 16, we would have 16 students, which cannot represent the total of 32 juniors. This ratio does not accurately reflect the data provided in the graph.
A ratio of 3 to 16 would imply that for every 16 juniors, 3 are majoring in engineering. If we calculate this, 3 divided by 16 would give us a fraction that does not match the actual number of engineering majors (12) when compared to the total (32). Thus, this choice is incorrect.
Choosing a ratio of 1 to 4 indicates that for every 4 juniors, only 1 is majoring in engineering. This would suggest there are only 8 engineering majors (since 4 × 2 = 8), which contradicts the information given in the graph showing there are 12 engineering majors.
This is the correct choice, as it accurately reflects the ratio of engineering majors (12) to the total number of juniors (32). When simplified, this ratio indeed equals 3 to 8 (12/32 = 3/8).
A ratio of 2 to 3 would imply that for every 3 juniors, 2 are majoring in engineering. This would suggest there are 21 juniors majoring in engineering (since 2/3 of 32 is approximately 21.33), which is inaccurate based on the graph data.
The analysis of the graph clearly shows that the correct ratio of juniors majoring in engineering to the total number of juniors is 3 to 8. All other options either misrepresent the number of engineering majors or provide ratios that do not correspond to the total student population illustrated in the graph. Understanding ratios is key to interpreting data accurately in various contexts.
Related Questions
View allIf y is any number in the list above other than the first number and i...
The diameter of a bicycle tire is 26 inches. If the bicycle travels 80...
For a class party, a teacher ordered three boxes of donuts, as shown i...
The members of an after-school dance club were divided into groups of...
If 2/(x - 2) = 0, then x =
Related Quizzes
View allPraxis 5001 Test with Answers
Praxis 5002 Study Guide
5002 Praxis Practice Test
Reading & Language Arts Praxis 5002
Praxis 5002 Reading and Language Arts Exam
Praxis 5003 Exam with Outline
5003 Praxis Math Answers
Praxis 5003 Study Guide
Praxis Social Studies 5004
Praxis 5004 Social Studies
- ✓ 500+ Practice Questions
- ✓ Detailed Explanations
- ✓ Progress Analytics
- ✓ Exam Simulations