The scatterplot above shows the amount of United States exports of trade goods to Australia in selected years from 1985 to 2015. Also shown is a trend line for the data with equation y = 0.65x + 4.6, which is used to predict the amount, y, in billions of dollars, of United States exports of trade goods to Australia x years after 1985. Based on the equation of the trend line, what is the predicted amount of United States exports to Australia, in billions of dollars, in the year 2030?
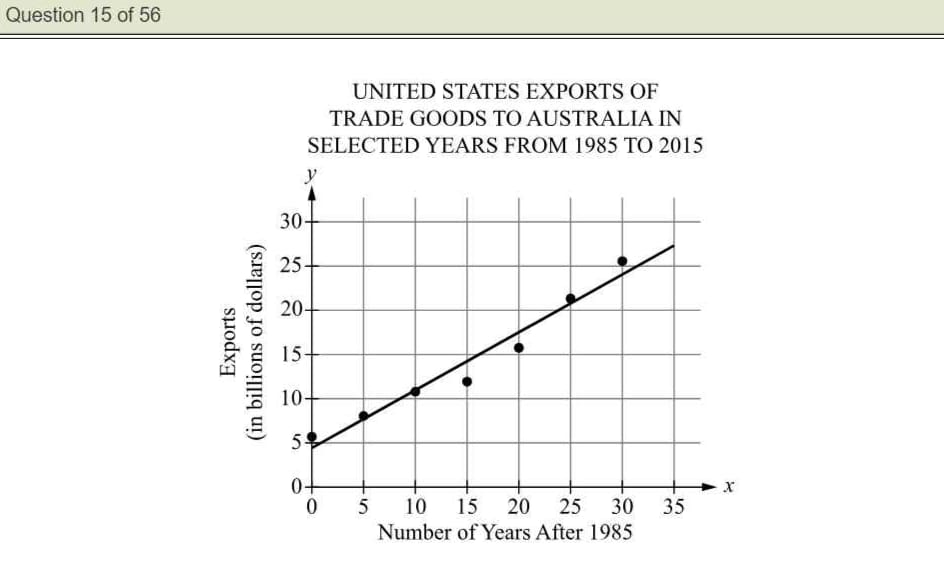
33.85 billion dollars is the predicted amount of United States exports to Australia in the year 2030.
To find the predicted exports for the year 2030, we calculate the value of x as 2030 - 1985 = 45. Substituting x = 45 into the trend line equation y = 0.65x + 4.6, we find y = 0.65(45) + 4.6 = 33.85.
This value is derived from an incorrect calculation of the trend line equation, likely using a significantly lower year value for x. As such, it does not reflect the exports predicted for 2030 based on the established trend.
Similar to option A, this choice results from a miscalculation of the equation or an incorrect substitution of x. The figure fails to account for the steady increase indicated by the trend line over the years leading up to 2030.
This option may represent an intermediate prediction based on a year closer to 2025 rather than 2030. However, it does not align with the accurate application of the trend line equation for the specified year of 2030.
This prediction suggests a continuation of exports beyond the established trend line, indicating a higher growth rate than what the equation supports. It inaccurately implies an unrealistic surge in exports that is not reflected in the linear trend established by the data.
The correct prediction for United States exports to Australia in 2030, based on the trend line equation, is 33.85 billion dollars. This value is derived from a straightforward application of the equation, emphasizing the importance of accurately substituting the correct year into the trend line to derive realistic financial forecasts. All other options represent miscalculations or misinterpretations of the data.
Related Questions
View allAlong a highway there is a post every 1/4 mile. Which of the following...
In triangle RST above, RS = RT. Which of the following must be true?
The scatterplot above shows a set of data values as well as a trend li...
The price of a sailboat increased from $12000 to $15000. What was the...
In a sequence, the first two terms are 10 and -6, respectively, and ea...
Related Quizzes
View allPraxis 5001 Test with Answers
Praxis 5002 Study Guide
5002 Praxis Practice Test
Reading & Language Arts Praxis 5002
Praxis 5002 Reading and Language Arts Exam
Praxis 5003 Exam with Outline
5003 Praxis Math Answers
Praxis 5003 Study Guide
Praxis Social Studies 5004
Praxis 5004 Social Studies
- ✓ 500+ Practice Questions
- ✓ Detailed Explanations
- ✓ Progress Analytics
- ✓ Exam Simulations