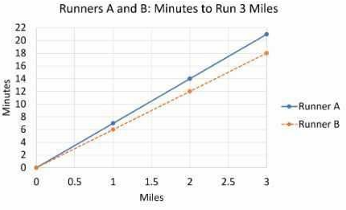
The graph below displays the time in which it takes Runner A and Runner B to run 3 miles. Which statement correctly interprets the slope of the data displayed?
Runner B is a faster runner because the slope of the data is 6.
In the context of the graph, the slope represents the speed at which each runner completes 3 miles. The lower the slope, the faster the runner, as they take less time to run the same distance. Therefore, a slope of 6 for Runner B indicates that they are faster than Runner A.
This statement is incorrect because the slope of 6 corresponds to Runner B, not Runner A. Additionally, the lower slope indicates a faster speed, so even if the slope of 6 did correspond to Runner A, this would make Runner A the faster runner, not the slower.
This statement is also incorrect. Even if the slope for Runner A were 7, this would mean that Runner A is slower than Runner B, whose slope is 6. A higher slope indicates a slower speed, as it takes more time to run the same distance.
This statement is incorrect because the slope for Runner B is actually 6, not 7. Moreover, if Runner B's slope were 7, this would make him slower, not faster, as a higher slope indicates a longer time to run the same distance.
The slope of a graph in this context represents speed. The lower the slope, the faster the runner. Therefore, with a slope of 6, Runner B is the faster runner. Misinterpretations of the graph's slope as it pertains to each runner's speed led to the incorrect conclusions in options A, B, and D.
Related Questions
View allWhich expression represents four more than a number is 12?
What is the length of a standard hiking trail segment?
Person A had 6 melons. Person B had 5 carrots. Person C had 20 grapes....
The hospital donates 0.075 of the money it makes in its gift shop to a...
There are four drinks on sale: 20 ounce cup for $4.00, 12 ounce cup fo...
Related Quizzes
View allNLN NEX Math Practice Test
NEX Math Practice
NLN NEX Math Quizlet
NLN NEX Science Practice Test
NEXT Generation Science Standards Intro
NLN NEX Science Quizlet
NLN NEX Science
NLN NEX Science Practice Questions
NEX Verbal
NLN NEX Verbal Quizlet
- ✓ 500+ Practice Questions
- ✓ Detailed Explanations
- ✓ Progress Analytics
- ✓ Exam Simulations