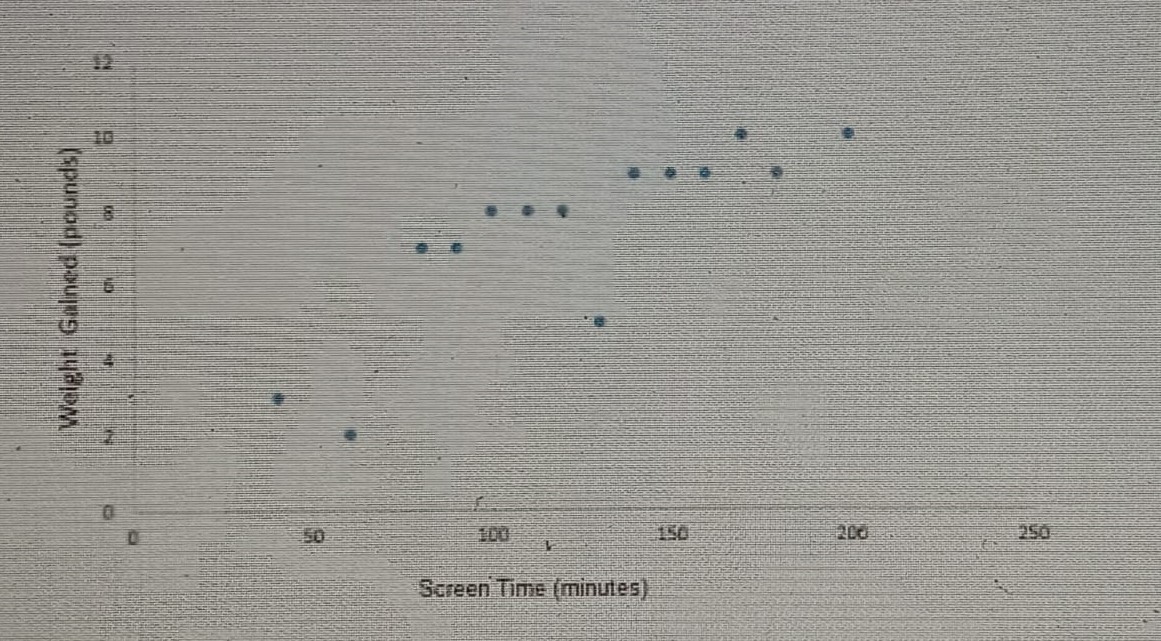
How will the removal of the outliers affect the relationship between screen time and weight?
It will weaken the positive relationship.
The removal of outliers in a dataset typically reduces the impact of extreme values that can disproportionately influence the correlation between two variables. In this case, by eliminating outliers, the overall positive relationship between screen time and weight will likely become less pronounced.
Outliers can skew the correlation, making it appear stronger than it is. By removing these extreme values, the data may show a weaker positive correlation between screen time and weight, as the remaining data points will more accurately reflect the typical relationship without the influence of the outliers.
Removing outliers usually does not strengthen a correlation; instead, it often leads to a more accurate representation of the relationship. If the outliers were driving a perceived strength in the correlation, their removal would likely diminish that effect rather than enhance it.
This option is incorrect because the context of the question pertains to a positive relationship between screen time and weight. Removing outliers does not create a negative relationship; it simply adjusts the existing positive relationship, likely making it weaker rather than switching its direction.
Since there is no established negative relationship between screen time and weight in the context of this question, this option is not applicable. The focus is on the positive correlation, and outlier removal affects only that aspect, not a non-existent negative one.
In summary, the removal of outliers serves to clarify the actual relationship between screen time and weight by reducing the influence of extreme values. This action typically weakens any apparent positive correlation, allowing for a more accurate assessment of how these variables interact under normal conditions.
Related Questions
View allWhich data indicate the relationship between gender and soda drinking...
Given the following dataset representing hours slept by patients in a...
A hospital's root cause analysis annual summary shows that 35% of the...
An urban community was concerned about lead levels in their water supp...
A patient is ordered 14 g of medication. The medication is available a...
Related Quizzes
View all0PC1 Planning Instructional Strategies for Meaningful Learning Version 1
AP01 Elementary Literacy Curriculum Version 1
ASO1 Introduction to Statistics for Research Version 1
BJ01 Introduction to Business Finance Version 1
C172 Network and Security Foundations Version 1
C180 Introduction to Psychology Version 1
C180 Introduction to Psychology Version 2
CKC1 Introduction to Humanities Version 1
DZ01 Mathematics for Elementary Educators III MATH 1330 Version 1
FF01 Human Growth and Development Version 1
- ✓ 500+ Practice Questions
- ✓ Detailed Explanations
- ✓ Progress Analytics
- ✓ Exam Simulations