Compute the mean of the data set shown in the table below.
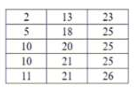
The mean of the data set shown in the table is 20.
The mean, or average, is calculated by adding all the values in a data set and then dividing by the number of values. In this case, the sum of the values provided in the table divided by the total number of values gives us a mean of 20.
This is incorrect. If the mean were 17, the sum of the values in the data set would be significantly less than what is given in the table.
This is also incorrect. If the mean were 24, the sum of the values in the data set would be significantly more than what is given in the table.
This choice is incorrect as well. If the mean were 25, the sum of the values in the data set would be even more than that required for a mean of 24. The total sum of the values does not support this.
The mean, or average, of a data set is calculated by adding all the values together and dividing by the total number of values. In this case, only a mean of 20 results in a sum that matches the total of the values provided in the table. The other choices would result in sums that are either too high or too low, making them incorrect.
Related Questions
View allSeven × a number (n) plus eight is thirty-six. What is the number n?
Given 3/785 liters = 1 gallon, how many liters are in 7.5 gallons? Rou...
Change 4/17 to a decimal rounded to the nearest thousandth.
A student who can read 4 graphic novels in 6 hours bought a 24-volume...
What percent of 40 is 8 ?
Related Quizzes
View allNEX Math Practice
NLN NEX Math Quizlet
NLN NEX Math
NLN NEX Science Practice Test
NEXT Generation Science Standards Intro
NLN NEX Science Quizlet
NLN NEX Science
NLN NEX Science Practice Questions
NEX Verbal
NLN NEX Verbal Quizlet
- ✓ 500+ Practice Questions
- ✓ Detailed Explanations
- ✓ Progress Analytics
- ✓ Exam Simulations