A city is tracking the amount of material recycled by households each month. The given box plot shows the results. To summarize the findings, the city wants to know which percentage of the households recycled between 120 and 160 lb.
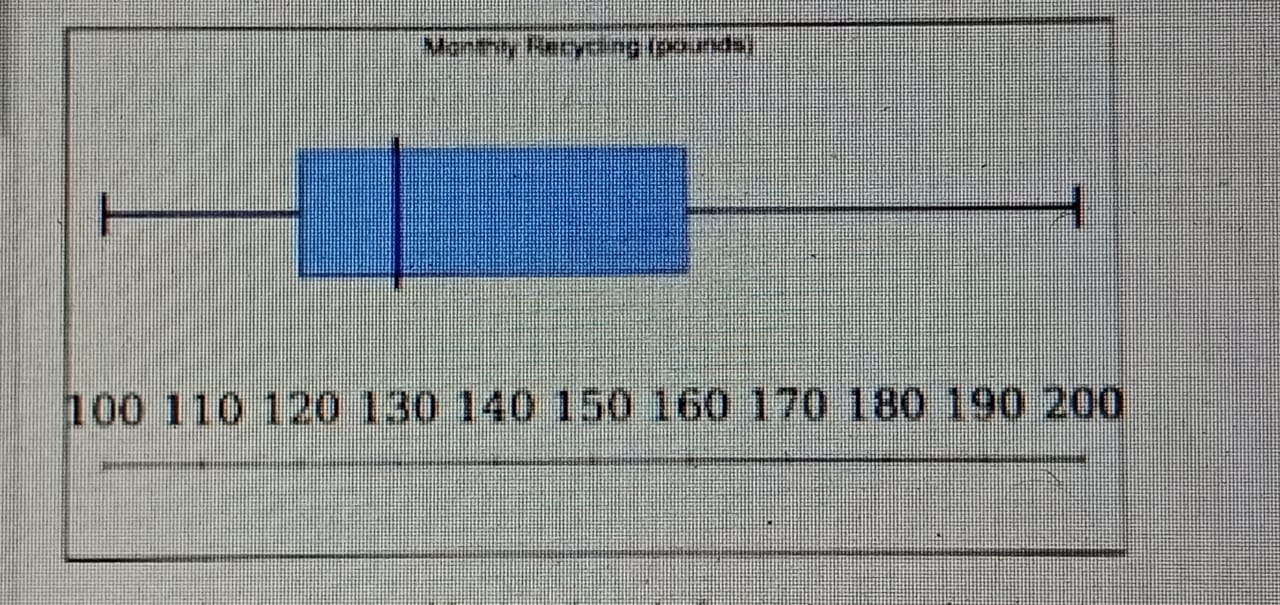
50% of the households recycled between 120 and 160 lb.
The box plot indicates that the interquartile range (IQR) covers the recycling amounts from the 25th percentile to the 75th percentile, which in this case is from 120 lb to 160 lb. This means that half of the households, or 50%, recycled within this weight range.
This choice suggests that 75% of households recycled between 120 and 160 lb, which exceeds the actual percentage represented by the box plot. The 75th percentile marks the upper limit of the IQR, indicating that only a portion of households reached this amount, not the majority.
Claiming that 100% of households recycled between 120 and 160 lb is incorrect, as the box plot shows that only a part of the data falls within this range. The presence of households recycling below 120 lb and above 160 lb indicates that not all households fall within this recycling amount.
This is the correct choice, as the box plot reveals that 50% of households recycled between the 25th and 75th percentiles, which correspond to the weights of 120 lb and 160 lb respectively. This range captures exactly half of the data, reflecting the interquartile nature of the box plot.
Choosing 25% implies that only a quarter of households recycled between 120 and 160 lb, which misrepresents the data shown. The box plot indicates that the amount of recycling between these two weights encompasses a greater percentage, specifically 50%, rather than a mere quarter.
The box plot effectively demonstrates that 50% of households recycled between 120 and 160 lb, as represented by the interquartile range. Misinterpretations regarding the percentages, such as those claiming 75%, 100%, or 25%, overlook the key function of the box plot in summarizing data distribution, particularly within the designated quartiles. Understanding these percentages is crucial for accurately assessing recycling behaviors in the city.
Related Questions
View allA triangle has vertices (1,2), (3,4), and (5,8). Which of the followin...
A company tracks the number of daily sales for three brands during a g...
The following box plot shows math test scores for a class of students....
Which of the following theorems could be used to prove triangle BCD is...
A college hosts a lottery using balls numbered 1 through 10. Four ×, a...
Related Quizzes
View all0PC1 Planning Instructional Strategies for Meaningful Learning Version 1
AP01 Elementary Literacy Curriculum Version 1
AQ01 Applied Healthcare Statistics C784 Version 1
ASO1 Introduction to Statistics for Research Version 1
BJ01 Introduction to Business Finance Version 1
C172 Network and Security Foundations Version 1
C180 Introduction to Psychology Version 1
C180 Introduction to Psychology Version 2
CKC1 Introduction to Humanities Version 1
FF01 Human Growth and Development Version 1
- ✓ 500+ Practice Questions
- ✓ Detailed Explanations
- ✓ Progress Analytics
- ✓ Exam Simulations