Rationale
In 2013, there were more pet dogs in the United States than there were in 1999.
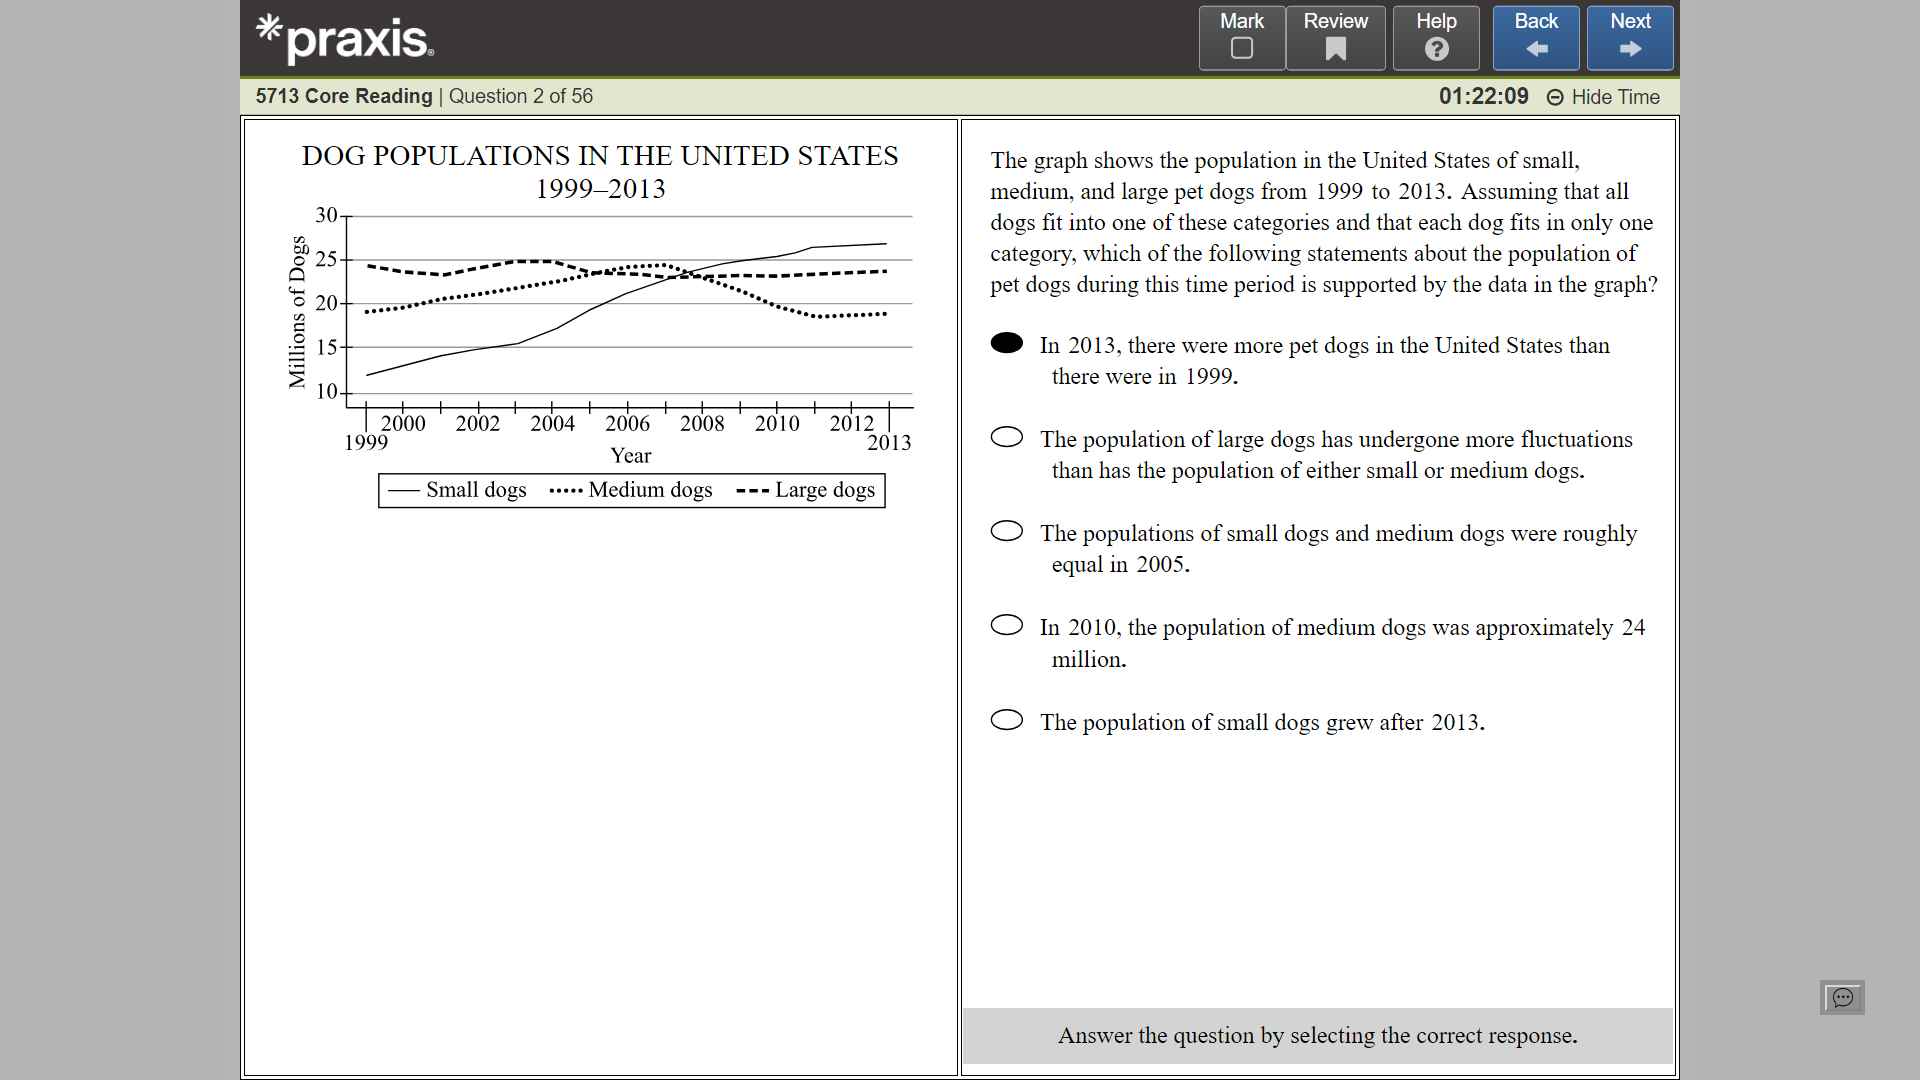
The graph indicates a general upward trend in the total population of pet dogs from 1999 to 2013, confirming that the number of dogs in 2013 surpassed that of 1999.
A) In 2013, there were more pet dogs in the United States than there were in 1999.
This statement is supported by the graph, which shows a consistent increase in the overall population of pet dogs over the years, leading to a higher count in 2013 compared to 1999.
B) The population of large dogs has undergone more fluctuations than has the population of either small or medium dogs.
While the graph may show some variations in the population of large dogs, it does not provide enough evidence to conclude that these fluctuations are significantly greater than those of small or medium dogs, which also exhibit their own variations.
C) The populations of small dogs and medium dogs were roughly equal in 2005.
The graph does not support this claim; in fact, it shows that the populations of small and medium dogs were not approximately equal in 2005, as one category consistently appeared larger than the other.
D) In 2010, the population of medium dogs was approximately 24 million.
This statement is incorrect as the graph indicates a different number for medium dogs in 2010, which does not align with the approximation of 24 million.
E) The population of small dogs grew after 2013.
The graph does not provide data beyond 2013, making it impossible to support any claims about population growth for small dogs after that year.
Conclusion
The graph illustrates a clear increase in the total population of pet dogs in the United States from 1999 to 2013, validating the assertion that by 2013, there were more dogs than in 1999. Other statements about fluctuations, equality in populations, specific population counts, and future projections lack sufficient support from the data presented in the graph.