The 50 students in Mr. Smith's third-grade class were asked to pick one color as their favorite. The results from the survey are shown in the preceding pie chart. Which THREE of the following questions can be answered from the information shown in the chart?
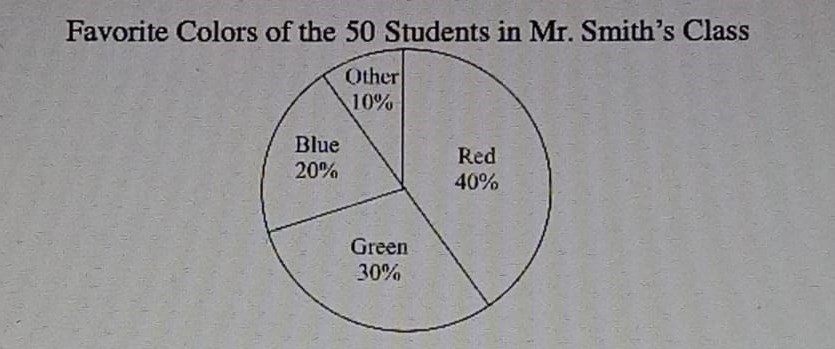
Which color is preferred the most?
The pie chart illustrates the distribution of favorite colors among the 50 students, allowing us to determine which color received the highest preference directly from the visual representation.
This question can be answered directly from the pie chart, as it visually represents the proportions of each color choice, making it easy to identify the most preferred color among the students.
While the pie chart shows the percentage of students who chose red, it does not provide the exact number of students. To determine this, one would need to calculate the number based on the total number of students, which is not explicitly stated.
The pie chart does not include any information regarding the sampling method employed for the survey. This question pertains to the methodology of data collection, which cannot be inferred from the results presented in the chart.
Though the pie chart indicates the proportion of students who selected purple, it does not provide the exact percentage directly. This requires further calculation based on the information depicted, making it less straightforward than the preferred color question.
The pie chart represents color preferences visually, but it does not provide the specific counts needed to determine the difference between the number of students who preferred green and blue. Thus, this comparison cannot be answered directly from the chart.
The pie chart effectively communicates which color was the most preferred among the students, making that question easily answerable. However, other inquiries about specific counts, sampling methods, or comparisons require information not provided in the chart, illustrating the limitations of visual data representation in answering detailed analytical questions.
Related Questions
View allWhich of the following is a composite number?
96, 62, 80, 65, 92. What is the median of the list of integers shown?
Based on the preceding computation, what is the value of 1085 / 12?
Garden snails can move as slowly as 0.1 inch per second and as quickly...
Samantha is 2 years younger than Jake. The total of their ages is 26....
Related Quizzes
View allPraxis 5001 Test with Answers
Praxis 5002 Study Guide
5002 Praxis Practice Test
Reading & Language Arts Praxis 5002
Praxis 5002 Reading and Language Arts Exam
Praxis 5003 Exam with Outline
5003 Praxis Math Answers
Praxis Social Studies 5004
Praxis 5004 Social Studies
Praxis 5004 Social Studies Subtest Practice Test
- ✓ 500+ Practice Questions
- ✓ Detailed Explanations
- ✓ Progress Analytics
- ✓ Exam Simulations