Last weekend, 625 runners entered a 10,000-meter race. A 10,000- meter race is 6.2 miles long. Ruben won the race with a finishing time of 29 minutes 51 seconds.
The graphs show information about the top 10 runners.
Based on the scatter plot, what is the range of ages of the top 10 runners?
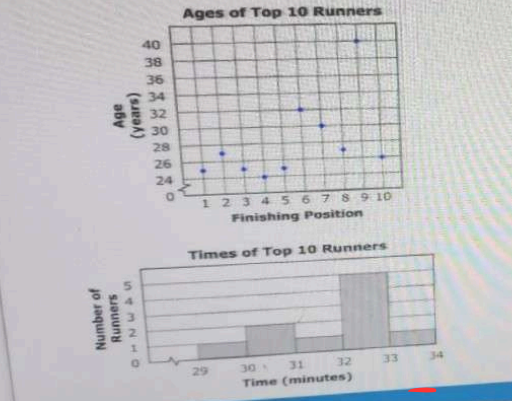
The range of ages of the top 10 runners is 16.
The range is calculated by subtracting the youngest runner's age from the oldest runner's age among the top 10 finishers. In this case, the ages span from the youngest to the oldest, resulting in a range of 16 years.
A range of 9 years would imply that the difference between the oldest and youngest runners is significantly smaller than what is indicated by the scatter plot. Given that the ages represented cover a broader spectrum, a range of 9 does not accurately reflect the data.
A range of 1 year suggests that all top 10 runners are nearly the same age, which is highly unlikely in a competitive race setting. The scatter plot shows a diverse age group, making this option incorrect.
The range of 16 years indicates a significant spread in ages among the top 10 runners, calculated by taking the oldest runner's age and subtracting the youngest runner's age. This value aligns with the information displayed in the scatter plot, effectively capturing the age diversity.
A range of 40 years would imply an extreme age difference not typically found in a competitive running event. The scatter plot does not support such a large variation, making this option invalid.
The age range of 16 years among the top 10 runners accurately reflects the diversity in ages as depicted in the scatter plot. This calculation highlights the competitive nature of the event, where runners of varying ages can perform at high levels, demonstrating that age diversity is a common characteristic in such races.
Related Questions
View allTwo points (a,b) and (c,d) are shown on a graph. Which of the followin...
On Monday; Alicia buys x shirts at $8 each and y slacks at $25 each. O...
The daily cost, C(x), for a company to produce x microscopes is given...
What is the equation of a line with a slope of 5 that passes through t...
A store manager recorded the total number of employee absences for eac...
Related Quizzes
View allGED Mathematical Reasoning
Mathematical Reasoning GED
GED Reasoning Through Language Arts
GED Reasoning Through Language Arts Practice Test
GED Science Sample Test
GED Science Test Prep
Sample GED Social Studies Test
Social Studies GED Test
- ✓ 500+ Practice Questions
- ✓ Detailed Explanations
- ✓ Progress Analytics
- ✓ Exam Simulations