If the trends represented on the table continued past 2012, which would be the most reasonable conclusion to draw?
The number of large dairy farms will increase and the number of small dairy farms will decrease.
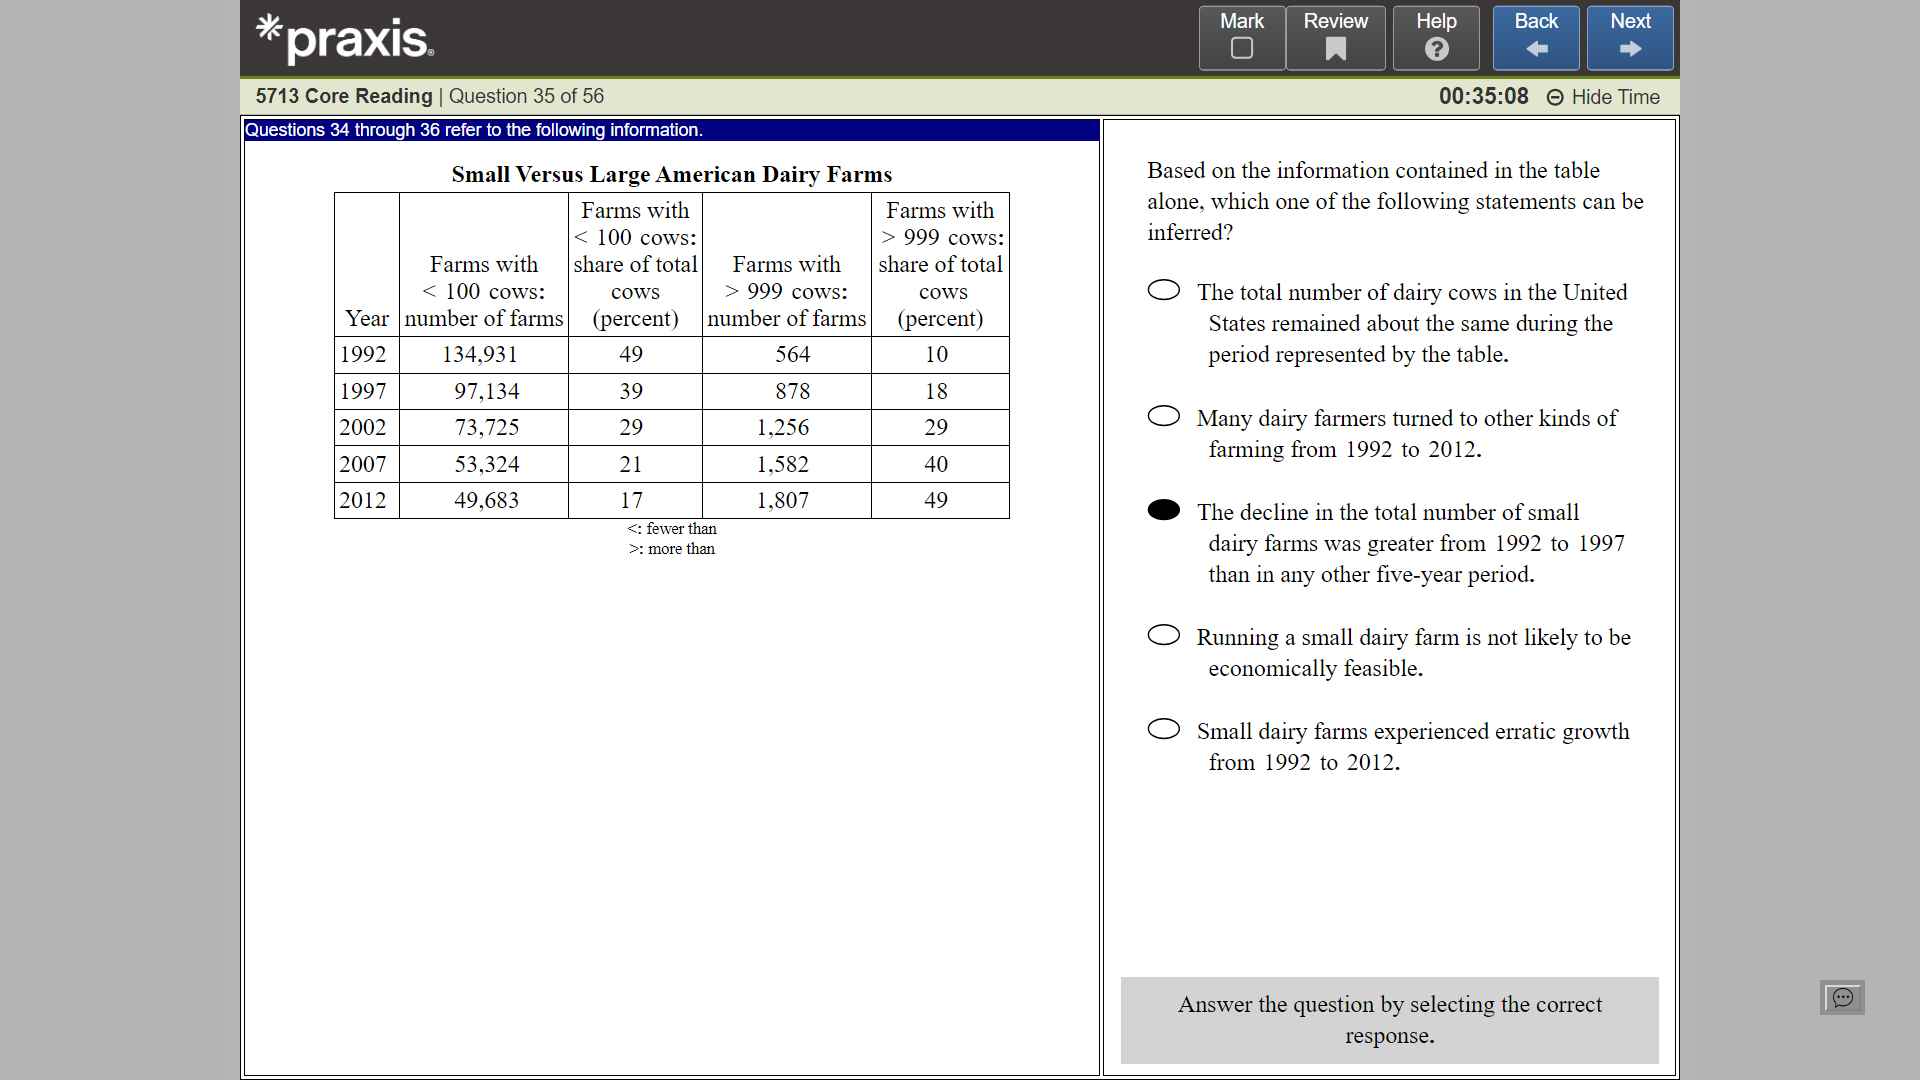
The data trends suggest a clear trajectory where large dairy farms are growing in number, while small dairy farms are declining. This indicates a consolidation in the dairy industry, favoring larger operations over smaller ones.
This conclusion is overly definitive and not necessarily supported by the trends. While the number of small farms may decrease, it does not imply they will completely vanish by 2022; some small farms may still operate despite a general decline.
This option contradicts the observed trends, which show an increasing number of large dairy farms and a decreasing number of small ones. Stabilization would suggest no ongoing change, but the data indicates a clear shift in the industry dynamics.
This statement implies that the growth of large dairy farms will cease, which is not supported by the trends. The data suggests continued growth rather than a leveling off, indicating ongoing industry consolidation.
This conclusion assumes a recovery of medium-sized farms, which is not supported by the trends indicating a decline in smaller farms and an increase in larger ones. The data suggests that medium-sized farms are unlikely to rebound if the current trends continue.
The trends in the dairy industry from the provided data clearly indicate that the number of large dairy farms is increasing while that of small dairy farms is decreasing. This ongoing consolidation reflects broader economic shifts within agriculture, leading to the most reasonable conclusion that large dairy farms will continue to rise in number, while small farms will diminish.
Related Questions
View allThe author of the passage cites Maxine Hong Kingston most likely in or...
The second paragraph serves which of the following functions in the pa...
Based on the information contained in the table alone, which one of th...
By using the phrase 'Its spell is gone' (lines 9 - 10), the author sug...
The graph shows the population in the United States of small, medium,...
Related Quizzes
View allPraxis 5001 Test with Answers
Praxis 5002 Study Guide
5002 Praxis Practice Test
Reading & Language Arts Praxis 5002
Praxis 5002 Reading and Language Arts Exam
Praxis 5003 Exam with Outline
5003 Praxis Math Answers
Praxis 5003 Study Guide
Praxis Social Studies 5004
Praxis 5004 Social Studies
- ✓ 500+ Practice Questions
- ✓ Detailed Explanations
- ✓ Progress Analytics
- ✓ Exam Simulations