A tree was 8 inches tall when it was planted. The graph above shows the height of the tree at the end of each of the first 4 months after it was planted. What was the tree's average (arithmetic mean) monthly increase in height during these 4 months?
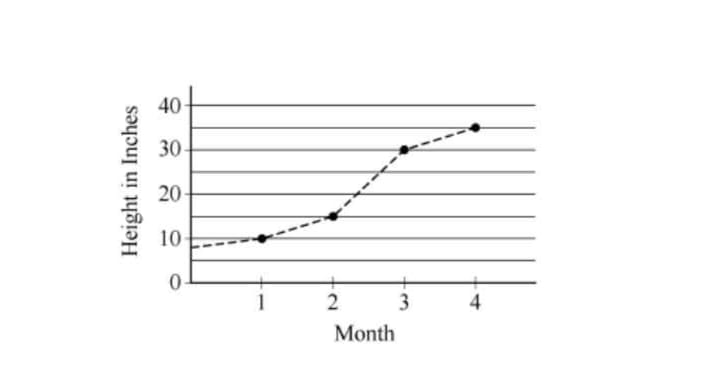
The tree's average monthly increase in height during these 4 months was 6 1/4 inches.
To determine the average monthly increase, we first need to find the final height of the tree after 4 months, which can then be compared to the initial height of 8 inches. The average increase is calculated by subtracting the initial height from the final height and dividing by the number of months.
This option suggests a monthly increase that is too low. If the total height increase were 5 1/4 inches over 4 months, the final height would only be 13 1/4 inches, which does not align with the data presented in the graph.
This choice accurately reflects the average monthly increase in height. If the tree started at 8 inches and reached a total height of 32 1/4 inches after 4 months, the total increase would be 24 1/4 inches. Dividing this by 4 months results in a monthly increase of 6 1/4 inches.
Selecting this option implies a greater monthly increase than what was calculated. A monthly increase of 6 3/4 inches would lead to a total increase of 27 inches over 4 months, resulting in a final height of 35 inches, which is not supported by the graph.
This choice also indicates an excessively high average monthly increase. A monthly growth of 7 1/4 inches would yield a total increase of 29 inches over 4 months, leading to a final height of 37 inches, which does not correspond to the data.
This option suggests an even larger average increase, which is not feasible. A monthly increase of 7 3/4 inches would result in a total height of 39 inches after 4 months, again contradicting the graph's data.
The average monthly increase in height of the tree, calculated from its initial and final heights, confirms that the correct answer is 6 1/4 inches. Each incorrect option suggests a different total height that does not match the graph, illustrating the importance of accurate interpretation of data when calculating averages.
Related Questions
View allIn the figure above, point P lies on one side of a rectangle, and poin...
A travel agency has booked 231 passengers for a bus trip. Each bus has...
A group of randomly selected residents of a town were asked if they ag...
If 2/(x - 2) = 0, then x =
A picnic cooler contains cans of orange soda and cans of grape soda on...
Related Quizzes
View allPraxis 5001 Test with Answers
Praxis 5002 Study Guide
5002 Praxis Practice Test
Reading & Language Arts Praxis 5002
Praxis 5002 Reading and Language Arts Exam
Praxis 5003 Exam with Outline
5003 Praxis Math Answers
Praxis 5003 Study Guide
Praxis Social Studies 5004
Praxis 5004 Social Studies
- ✓ 500+ Practice Questions
- ✓ Detailed Explanations
- ✓ Progress Analytics
- ✓ Exam Simulations